When electronics meets machine learning
By Ilana Stolovas and Joaquin Bengochea
In this post we attempt to summarize the experience of working on a project that combines signal processing, machine learning and electronics. Its goal was to develop a manipulable sensor-embedded device from which to infer the kind of movement or activity performed by its user. By inference we mean the classification of the activity based on a set of predefined, known classes.
Those three mentioned fields have generated interest individually for decades, and each one has a variety of challenges characteristic of its nature. Therefore, we aim to give our readers a glimpse of the main challenges we faced when addressing the project.
Electronics understanding
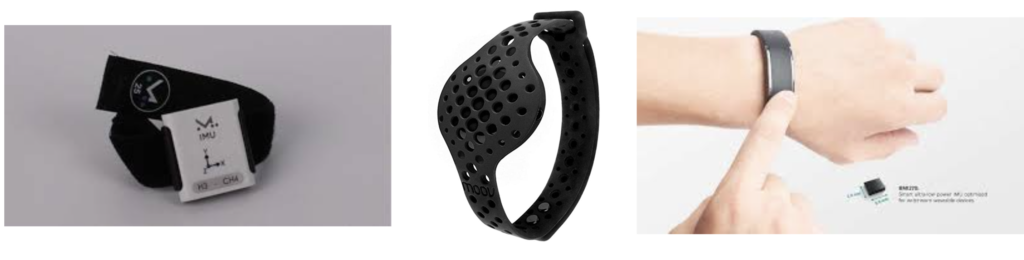
The centerpiece of the device is an inertial measurement unit (IMU) containing an accelerometer and a gyroscope. The first one measures the acceleration of the device, and the second one the angular velocity (both in three axes). Although we did not design the hardware for this project, we made sure that we can receive and interpret the measurements formatted to a communication protocol. For this purpose, we transmitted the data through BLE (Bluetooth Low Energy) to a PC that stores the information gathered from the device.
In the first place, we needed to interact with the device to collect the data and coherently process it. For example, a change in the sampling frequency needs to be taken into account to ensure compatibility. When working with angles formatted on 16-bits, a posterior phase unwrapping step is required. Being aware of the hardware specifications is crucial to define which type of processing techniques to apply.
Signal processing
Since data is not information by itself, raw measurements do little to solve the problem without a posterior processing. Therefore, signal processing comes to translate these raw measurements into valuable information.
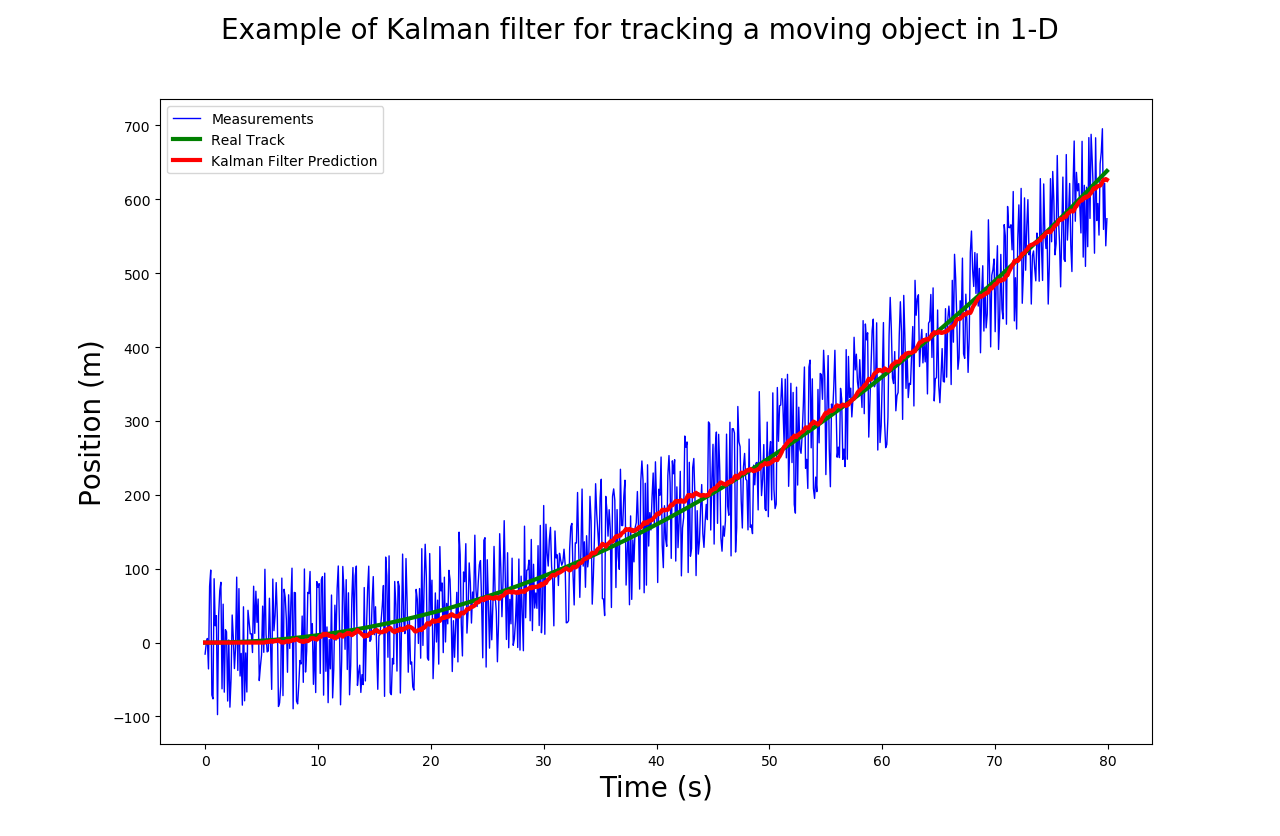
We analyzed the data range, periodicity and noise impact, and applied bandpass and Kalman filters to smooth the signal. When working with multivariate data, dimensionality transformation can be useful: triaxial measurements can be transformed into unidimensional ones (as a magnitude) or projected onto spaces of more interest (e.g., quaternions, PCA). Observing different data representations leads us to a better understanding of reality. As an example, when the measured acceleration is constant and its magnitude is equal to gravity, that means the device is left at a still position.
Machine learning
A successful machine learning model requires good quality data. That means either looking for a publicly available dataset or building a custom one. We chose the second option, as data must accurately represent the IMU’s output.
To build the dataset we must define which activities (or classes) to sample, get the data and label it properly. It is also important to know if some kind of segmentation is needed, if the start and end of the activity is defined or if we need to recognize them from the data.
If we want the model to generalize, we must feed it with the most relevant variations. In our case, performing the activities by different persons, on different days. Building a dataset may require a long time and can be done gradually: starting with a few classes while moving forward on exploratory data analysis and models benchmarking. We know this process is long and tedious, so it is imperative to do it in parallel with other tasks.
With the dataset in hand, it is time to start with the feature engineering. Is the raw data enough? Is every class represented with the same features? Would it be useful to craft new features by projecting existent ones into other space? And aggregating them?
Also, how will we be receiving the data at inference? If we have to process the data in real time, maybe a sliding window algorithm suits better, but if we need to process all the data at the same time, maybe it’s better to feed all the data as a whole.
We then started the modelling part. As always, we started from the simplest models, such as SVMs and travelled our way to the more complex ones, like LSTMs and CNNs. The latter, for example, is a common computer vision model, but can be adapted to time series data by convoluting in only one dimension. Best solutions ofter requires some out of the box thinking.
Lastly, we need a way of measuring how good our model is. Here is where metrics come into play. Choosing the right metric for your model and your data is crucial to asses the performance of the project. If you know that the data is skewed towards certain classes, for example, an accuracy metric could not reflect the model’s performance, so another metric like F1-score is needed.
Summing up
In the journey of this very innovative project, we tested our ability to incorporate different disciplines into the development. We successfully faced the challenges we discovered in each of the mentioned areas.
It is important to do a thorough initial research, and iteratively refine it later when having a deeper understanding of the project. This way you cannot miss out any state of the art techniques. Like in every project, the most promising options are often riskier, and the more classic and safe approaches are usually more limited.
Finally, we reached a hands-on understanding of the project and the different areas that impact in it: defining, analyzing, experimenting, developing (and redefining).

