Social Distancing: a computer vision approach
By Ilana Stolovas
Social distancing has been proven to be one of the most effective measures against the spread of the new Coronavirus (COVID19). As part of the so-called ‘New Normality’, many institutions have implemented different ways of controlling distances, from stickers on the floor up to applications or alarm bracelets. This post will present a computer vision approach, which consists of an automatic estimation of inter-personal distances from an image or video, and an easy-to-try implementation example.
In this post we will talk about:
- Pedestrians detection: recognising pedestrians in a video frame
- Perspective adaptation: get rid of the perspective bias
- Distance measurement: locating the pedestrians and estimating distances
- Social Distancing indexes: useful to quantify how distance restriction policies are met
After reading this post you will be able to try an easy implementation of the presented algorithm with any video extract at your choice.
Pedestrians detection

The first step is to recognize the people in the camera frames. There are several algorithms for detecting and classifying objects from images. State-of-the-art object detectors use deep learning approaches (e.g. Faster R-CNN, YOLO), consisting of pre-trained deep convolutional neural networks (CNN) which detect individuals with bounding boxes in a given monocular camera frame. This classifiers are trained with large datasets of labeled pictures, e.g. COCO, Imagenet.
To clean up the output, it is common to apply some post-processing, such as non-max suppression (NMS), which eliminates duplicate bounding boxes.
But distance measuring cannot be easily done using only the bounding boxes provided by the detection algorithm, as sizes and pixel distances strongly depend on the perspective view of the camera.
Perspective adaptation
A ‘must-do’ when dealing with big areas, like stadiums, train stations or even shopping malls.
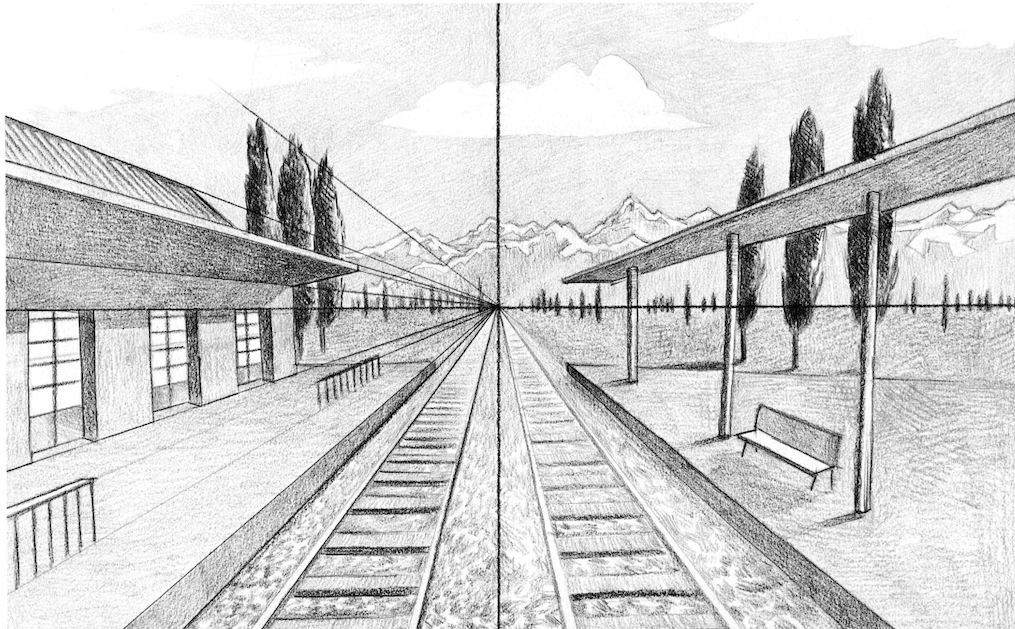
As the input video may be taken from an arbitrary perspective view, the pixel distance between two objects that are closer to the camera and between two further objects may be the same, but real distances can strongly differ, as bounding boxes’ sizes also change.
The next step of the pipeline is computing the transform (called Homography) that maps this perspective view into a bird’s-eye (top-down) view. Distances are more precisely measured when points are seen from above.

To compute the mapping, we need to define the Region of Interest (ROI), which can be determined with four points in the -fixed- camera frame, and can be set at first and remain constant. Here we assume planarity in the region of interest. These points are assumed to correspond to a rectangle seen from above.
The next step is to define the distance threshold. Some implementations require to define it manually, which can be determined by the height of a person in the picture (approximately 6 feet). A more precise setup may require to set the actual threshold on the floor, as it is the plane in which the homography is done.
Another common approach is to calibrate fixed cameras by observing the motion of dynamic objects such as pedestrians. Recently, approaches based on deep learning attempt at estimating directly camera pose and intrinsic parameters on a single image.
Distance measurement
With the homography defined, the next step is to map the bounding boxes to the bird’s eye view ‘ground’ plane, by transforming the center of each bounding-box’s bottom points, in order to have a (x,y) location for each person in the ground level. Knowing the transformation scaling factor (how many pixels correspond to 6 feet in real life) it is now possible to measure euclidean distances between each pair of points and alert proximity.
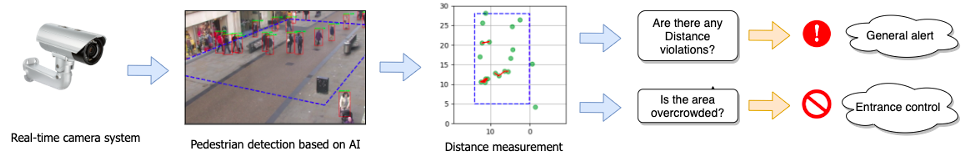
Social-distancing indexes
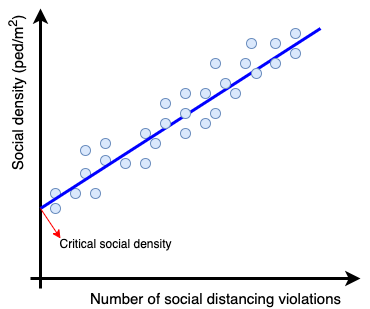
As mentioned before, social-distancing algorithms can not also detect single distance violations, but also compute statistical parameters in order to prevent overcrowding. Researchers from The Ohio State University have developed a ‘Vision-based Social Distancing and Critical Density Detection System’ [1], which defines a critical social density metric and advises not entering into the ROI if the density is higher than this value. The critical social density value is obtained by regression techniques providing the social density on a frame and the number of distance violations on it.
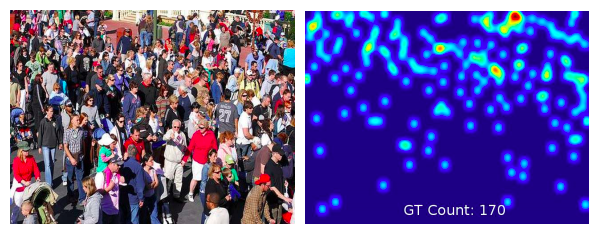
Other researchers have implemented the violation index representing the ratio of the number of people to the number of groups, where a group means a cluster of people not respecting social distance [2]. Another approach involves estimating count and density maps from crowd images using CNN trained for this task [3], as it is illustrated in the picture below.
Implementation example
There is an easy-to-try free python implementation of the described algorithm in: https://github.com/aqeelanwar/SocialDistancingAI. The project asks the user to mark 6 points on the frame, 4 of them corresponding to the ROI (bottom left, bottom right, top left, top right) and 2 points assumed to be 6-feet apart. The project makes use of an example video and it is easy to change it and try new scenarios. The output provides the bounding boxes in the original video and a bird’s eye view window to easily track the pedestrians.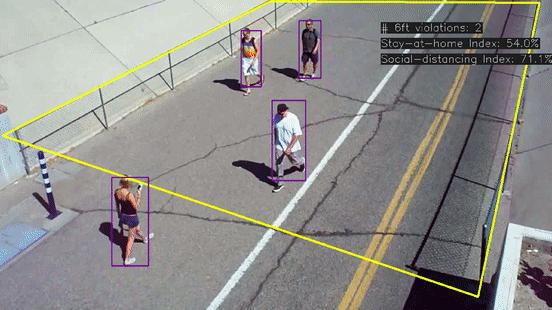
Further research
A research from the University of Trento, Italy [4], has come to a method to detect the presence of social interactions in a surveillance scenario, distinguishing between casual and intentional interactions, where intentional events are further subdivided into normal and abnormal behaviors. The extracted features are analyzed through a multiclass SVM.
Along the research I have also come across an article about distance measuring that is worth looking, but considering the distance from the camera to the object that it pictures. It is deep-learning based, and was trained using a supervised learning technique where the input features were manually calculated parameters of the object bounding boxes and outputs were the accurate 3D laser scanner measurements of the distances to objects in the recorded scene. More details in [5].
References:
- [1]: ‘A Vision-based Social Distancing and Critical Density Detection System for COVID-19’
- [2]: ‘Monitoring COVID-19 social distancing with person detection and tracking via fine-tuned YOLO v3 and Deepsort techniques’
- [3]: ‘A Survey of Recent Advances in CNN-based Single Image Crowd Counting and Density Estimation’
- [4]:’Real Time Detection of Social Interactions in Surveillance Video’
- [5]:’DisNet: A novel method for distance estimation from monocular camera
- Also: IEEE, ‘The Visual Social Distancing Problem’: link

